Creative Infographics, the most modern way to show how something works.
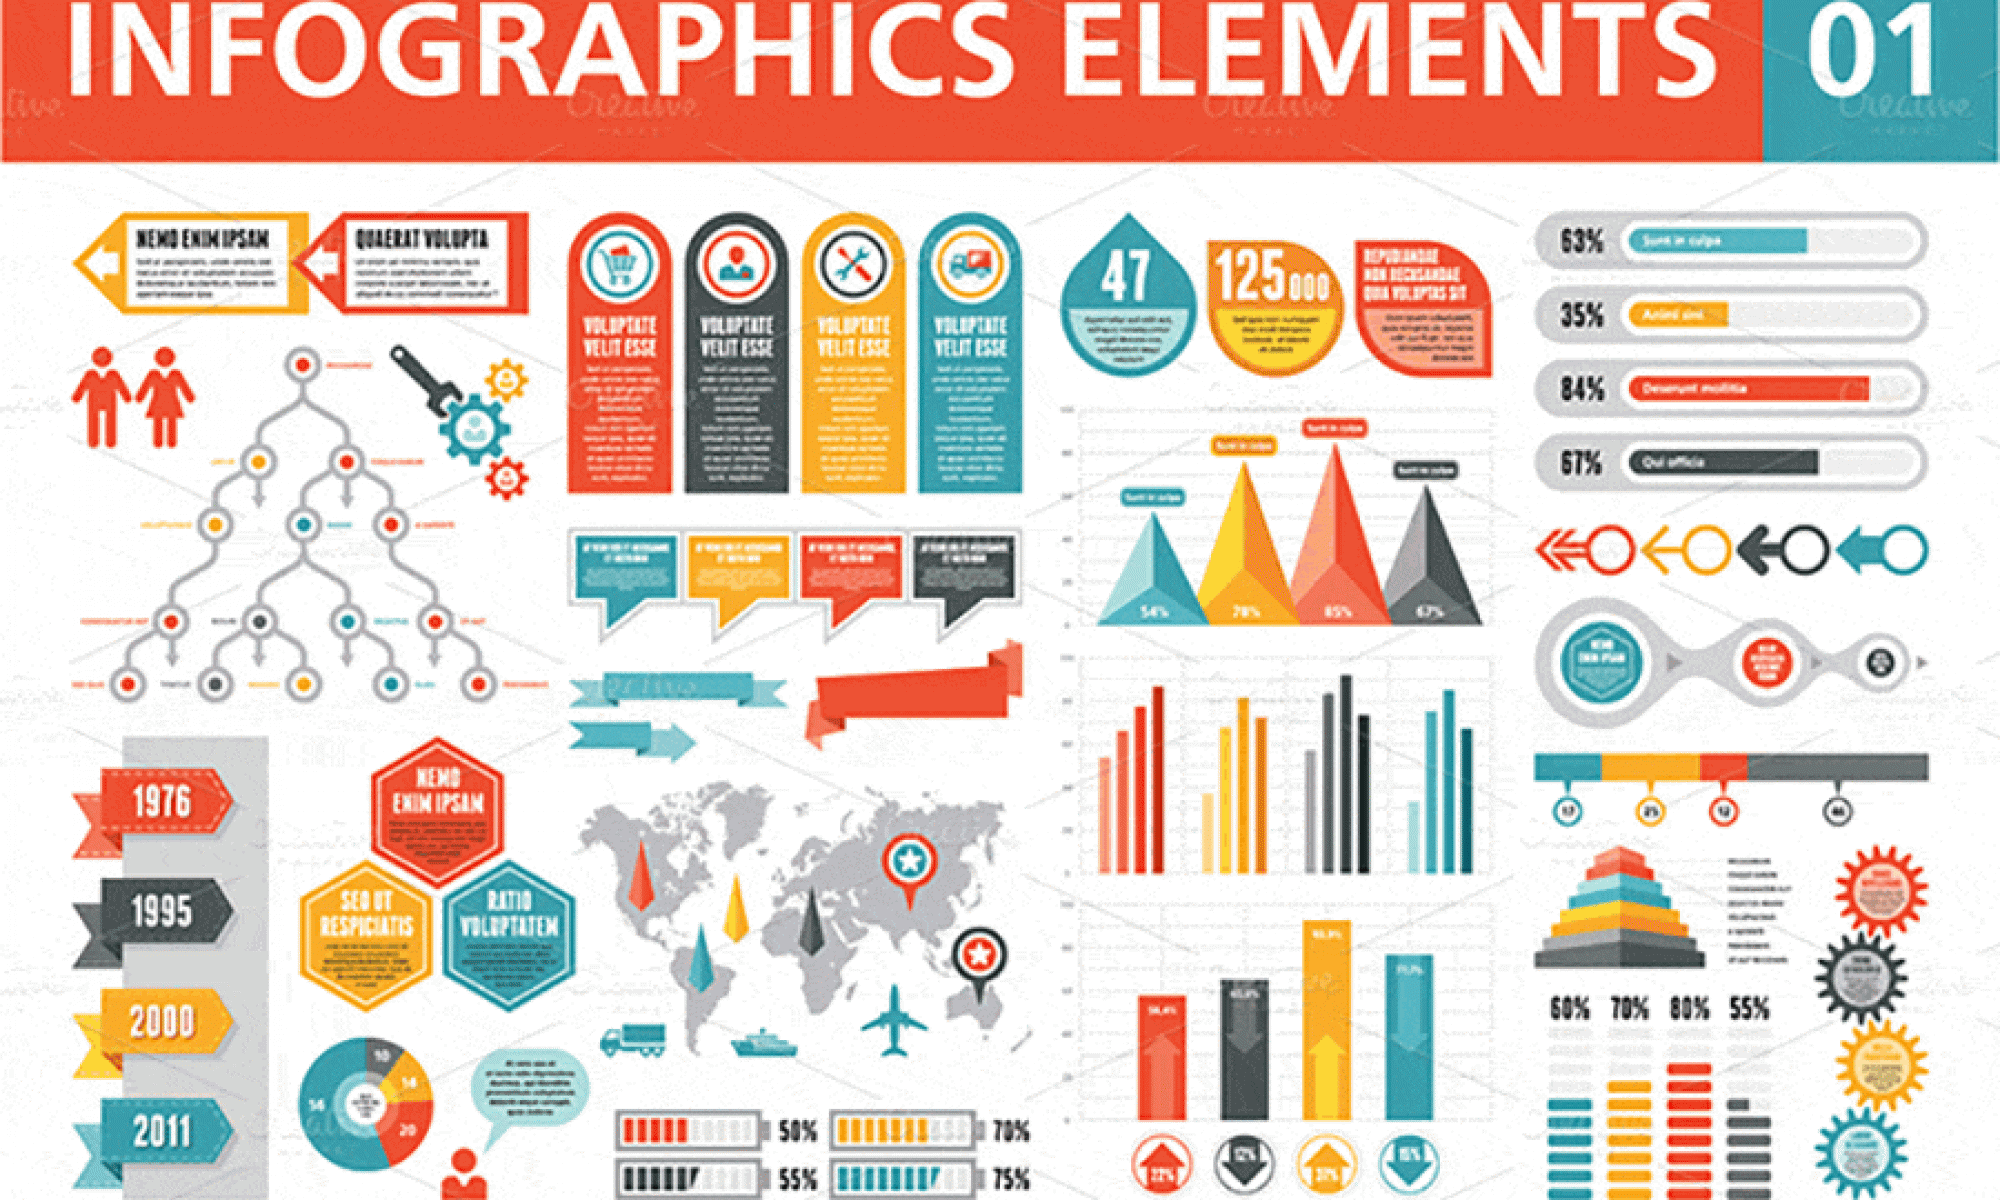
Creative infographics like a service, a products or anything else that needs simple explaining. Many large and small businesses are using infographics these days to show their process or to provide other step by step information or most commonly to introduce themselves and show what they do in a visual way.
Number one is an infographic from Kentico Content a Management System.
1. CORNWALL BY DESIGN
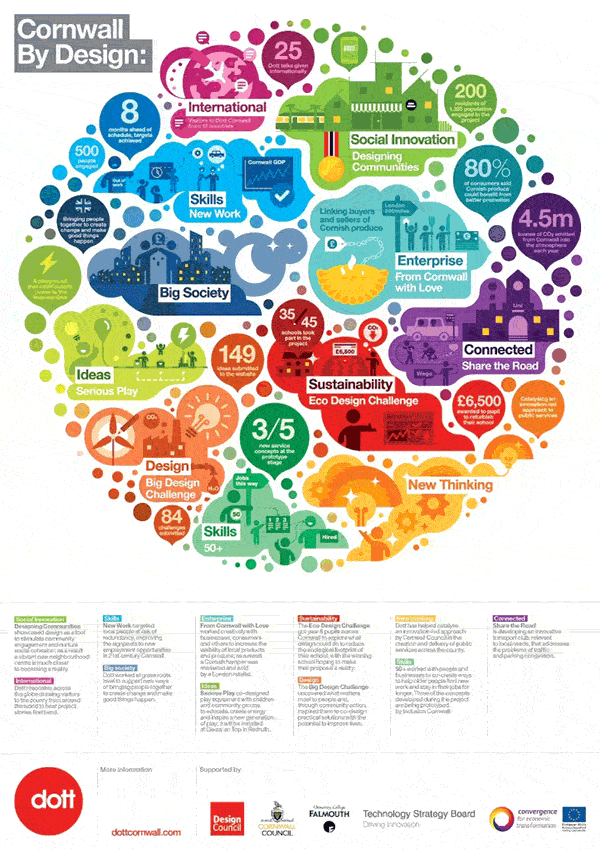
Image source | http://devnet.kentico.com
Infographics turn regular otherwise boring data into something interesting. Infographics allow us to read less and see more. They make something terribly boring into something fun and interesting to look at, they turn introductions and instructions into simple and easy to understand visual data.
2. WORDSTREAM
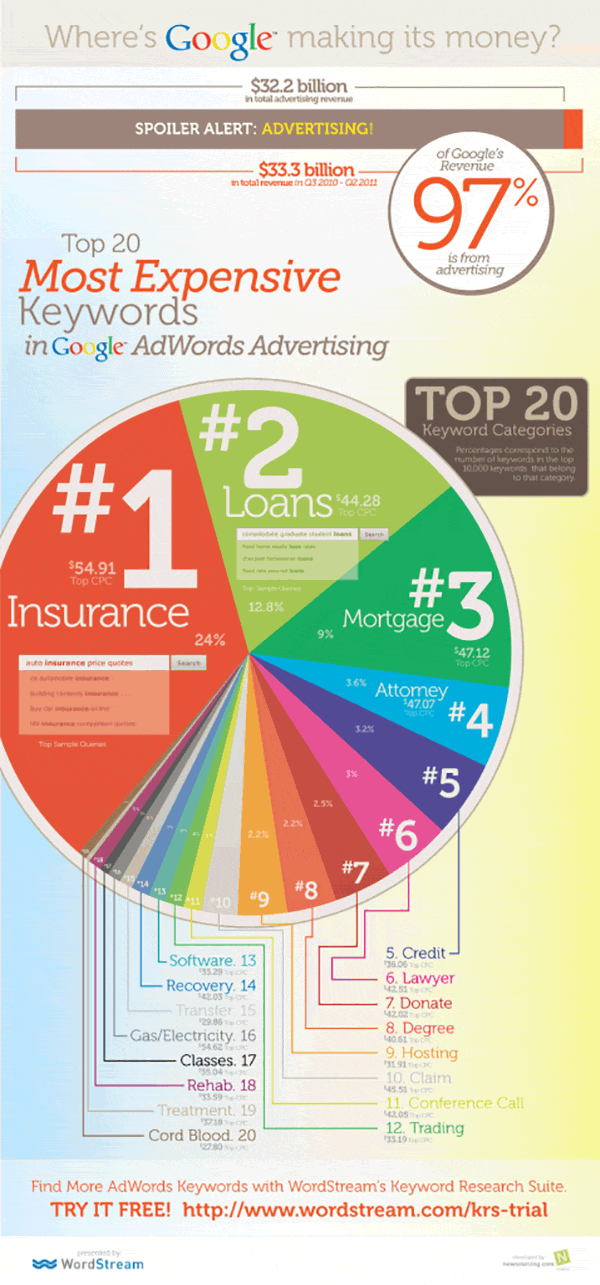
For designers it is not as easy as it may look to create a successful infographic, a great infographic needs to be carefully created using strategy. Infographics are very technical as they are like graphs and diagrams but they are just more interesting and much less boring or not boring at all really because they are just so interesting.
3. FORTUNE 500

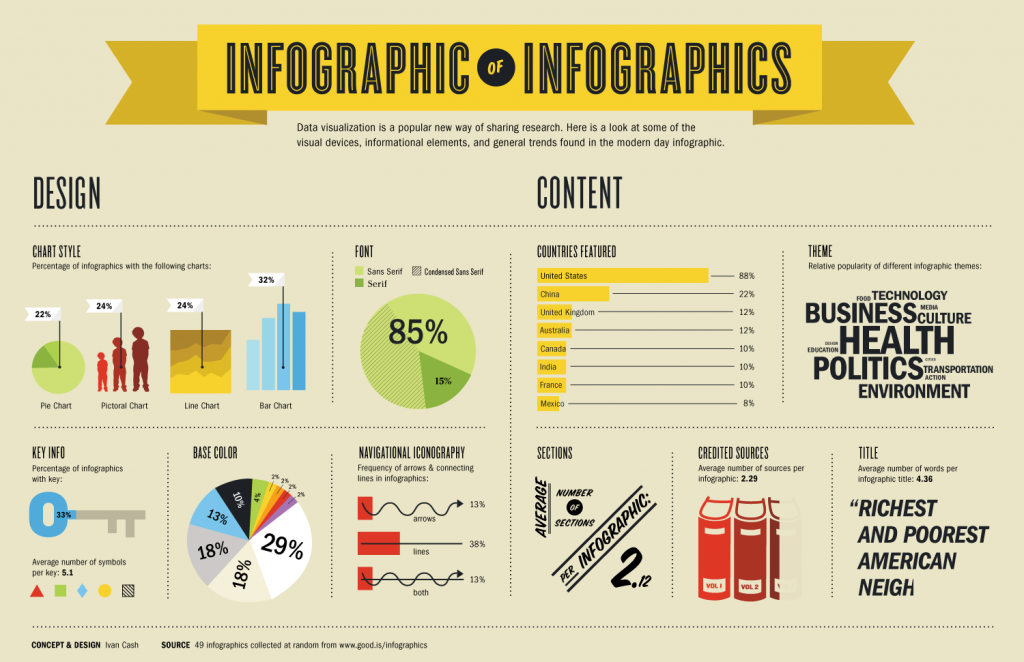
4. INFOGRAPHIC OF INFOGRAPHICS
5. BRAIN SIZE COMPARISON
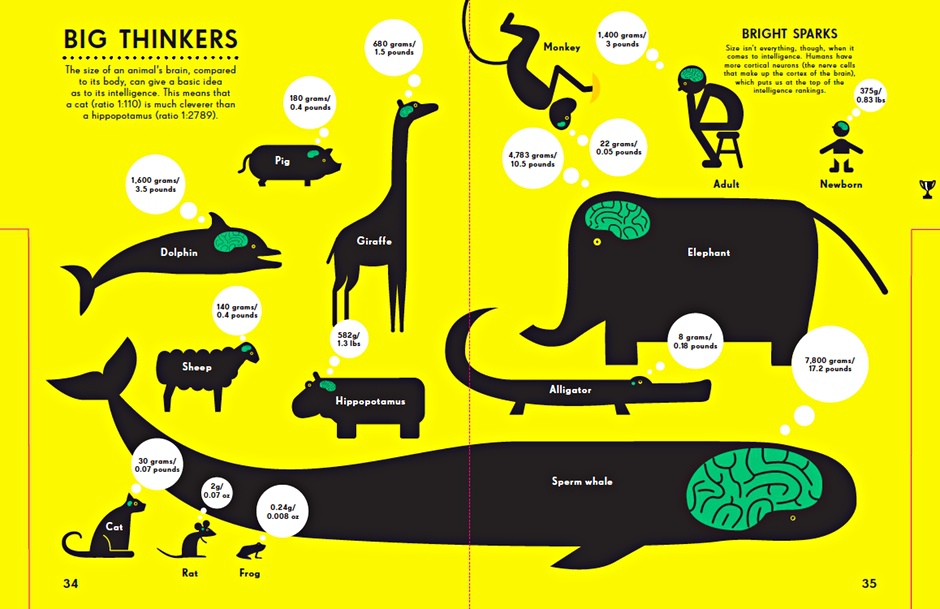
6. CREATIVE MARKET
7. WHERE THE RICHEST PEOPLE LIVE
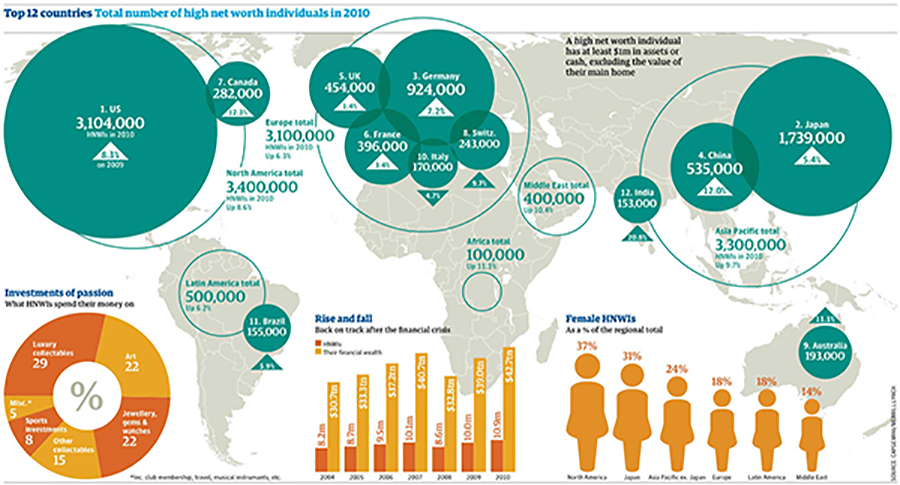
8. RETRO STYLE INFOGRAPHIC
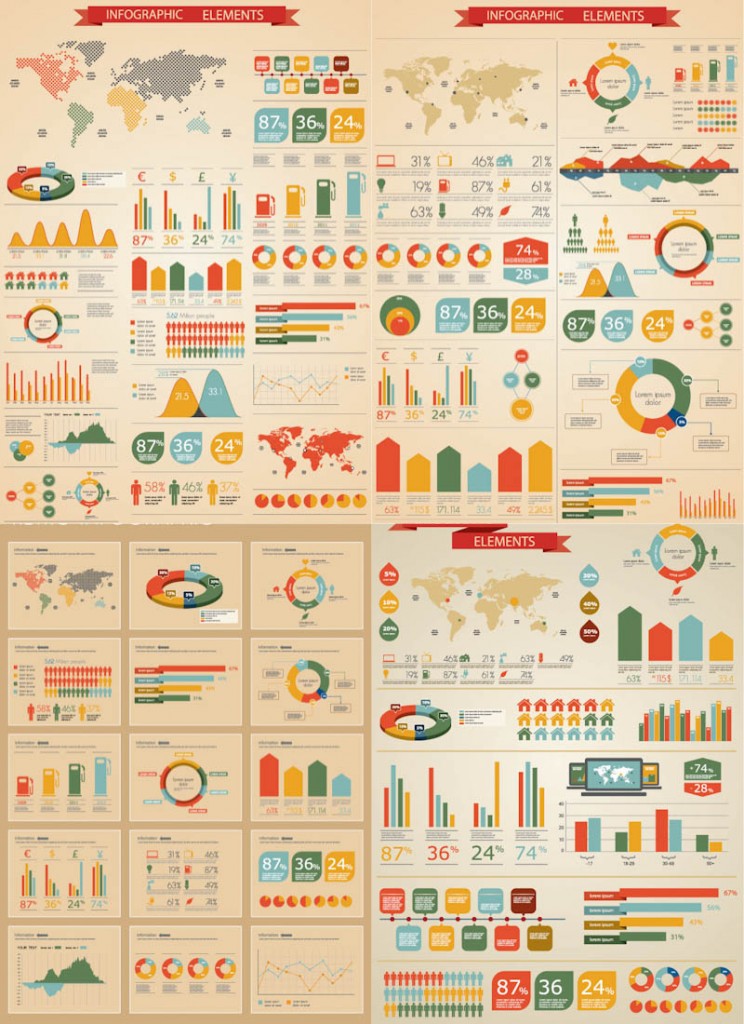
9. COOL INFOGRAPHICS
10. LOGOLAND LOGO DESIGN PROCESS
www.logoland.com.au

When designing an infographic it’s important to have a plan, a strategy and to keep the design simple and easy to understand. A great infographic will be easy to read, the viewer should be able to look at the images and understand what the message is.
Thank for reading creative infographics! If you liked this post please link to our blog or visit us on Facebook and like us, www.facebook.com/logolandaustralia
Similar posts that may interest you
The purpose of a logo and its design
What is the advantage of having a logo designed online?
Logo Design Process
Why it’s important to have a professional business image


